Traces in Explore
Trace View lets you to view and analyze distributed traces directly in Explore, offering a comprehensive understanding of your system's activity. It helps correlate logs with traces to identify bottlenecks, pinpoint errors, and understand your application's complete execution path.
Configure Trace view
To enable Trace View in Explore, you’ll need:
- An active Logz.io Tracing account.
- A
traceIDortrace_idvalue for all traces and logs correlated with traces. Most OpenTelemetry-compliant tracing and logging libraries handle this automatically using trace context. Use Logz.io’s collector to send your traces and Logz.io’s SDKs to send trace-context-propagated logs.
Logs and traces are correlated using the traceIDor trace_id fields. Make sure these fields have the same value in both logs and traces for proper integration with trace context.
After configuring your logs and traces, expand a log entry in Explore to verify that the Trace tab displays the associated trace data.
Logz.io Tracing accounts have a retention period of 10 days, meaning correlated logs may no longer display traces beyond this timeframe.
Supported integrations for Trace context:
Additional integrations will be available in future updates.
Viewing Traces in Explore
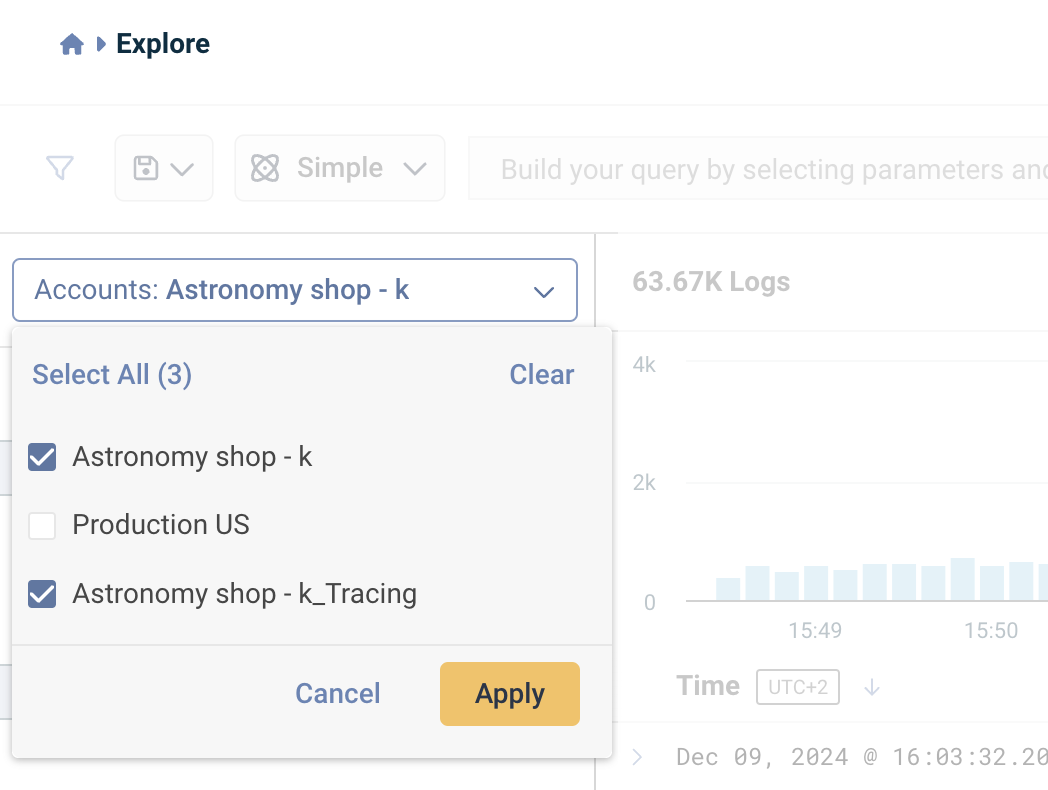
Navigate to Explore and select accounts that include tracing data.
Expand a log entry. The Trace tab will appear alongside the Log tab. If the log is correlated with a trace, the Trace tab displays trace data, including spans, service names, and durations. Click on a span within the trace to view the corresponding log data directly within the same interface.

Best Practices and troubleshooting
Follow these tips to ensure Trace View works seamlessly and resolve any issues with missing traces:
- Maintain Consistent Trace IDs: Ensure the
trace_idis consistently propagated across all services to enable proper correlation between logs and traces. - Optimize Sampling and Filters: Adjust sampling limits, refine filters, or increase the sample size to capture sufficient trace data.
- Verify Instrumentation: Ensure instrumentation is set up correctly in your application and tracing libraries.
- Include Trace Context: Confirm that the
traceIDortrace_idfield is present and consistent in both logs and traces. - Reconnect and Resend Data: If traces are not appearing, try reconnecting and resending your trace data to Logz.io.
- Minimize Noise: Avoid logging excessive trace data to keep logs clean and focused.
- Validate Regularly: Periodically check that logs and traces are correctly linked in the Trace View tab to ensure everything is functioning as expected.
For further assistance, contact our support team.